Usage & Productivity Measurement
Visibility across all User Actions and Productivity in one place
Analytics for all apps
Ensuring application success across the enterprise starts with getting the RIGHT data to inform decision making. Application data comes from platforms, web and mobile applications, legacy systems, chat bots, and more.
The Pyze Cross Platform Analytics suite unlocks access to all data mediums to analyze application business performance for the entire enterprise. Data tools like smart dashboards, data insights, and automated segments enable enterprises to visualize data allowing CXOs to measure achievement of business objectives and make resource allocation decisions.
Integrated Productivity and Efficiency Analytics Across all apps
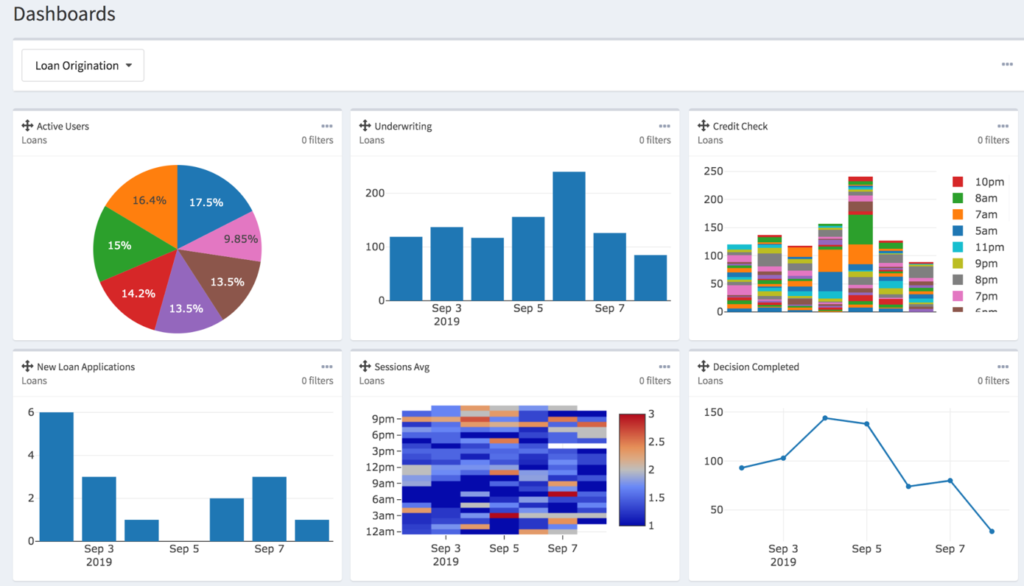
Smart Dashboards
Use custom dashboards to understand key usage, productivity, and efficiency metrics in one location. Evaluate user productivity across tasks, journeys, and business processes across multiple applications in one smart dashboard visualization.


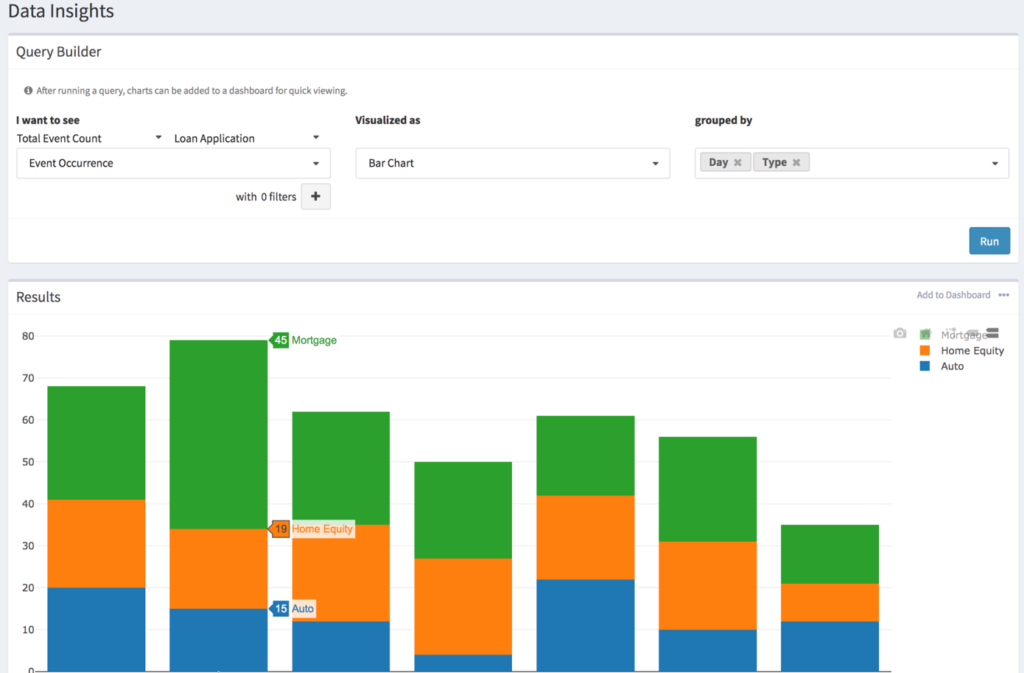
Data Insights
Understand aggregate trends, compare segments of users, or drill into an individual user’s performance. Pyze Data Insights analyzes cross-application data to identify what characteristics cause users to behave differently and answer key business questions like what makes some users more productive and others less productive. What’s on your mind?
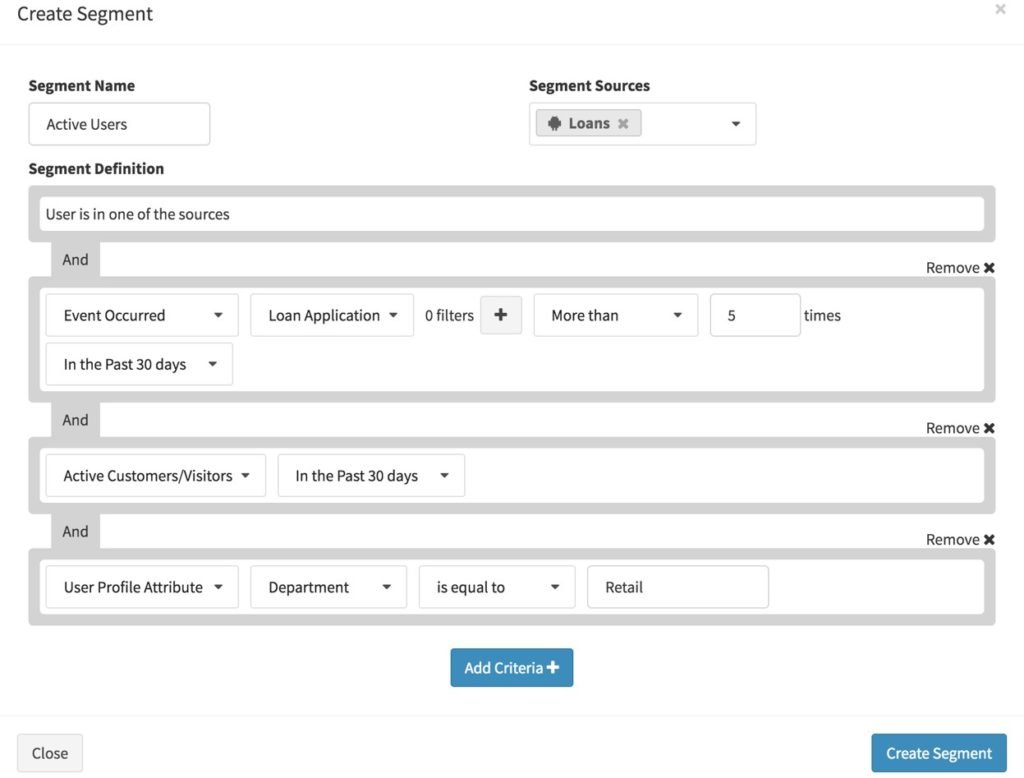
Automated Segments
Identify groups of users utilizing usage behavior, business actions, and user profile attributes. Automated segments span platforms and applications to provide a holistic understanding of user behavior in multiple platform work streams. Not sure which segments are interesting? Let Pyze suggest the best criteria to use for segmenting users based the attributes cause users to behave differently.

